Test SSD Performance like the Pros

Test Procedure for SSD Performance Measurement
If you are just doing some quick benchmarking or just getting started with FIO, check out the [FIO Basics post]. Have you ever wondered how the spec sheet performance numbers are measured on an enterprise or data center SSD? Want to make totally awesome graphs like the one below? To measure SSD performance correctly, you need to understand how SSDs work. You can follow the [SNIA SSS PTS] here if you want the gory details, but we can follow the main five steps.
Solidigm D7-P5520 7.68TB, firmware 9CV10410. Measured on Ice Lake 6338, Supermicro SYS-120U-TNR
1. Reset drive to FOB
Get the device back to FOB, or fresh out of box state. This is sort of like a factory reset. To the SSDs, it means that all the LBAs are deallocated (not storing any valid user data). Remember, all the SSD knows how to talk to the host is in LBAs, or logical blocks. It doesn't know anything about the underlying filesystem, files, or what data is valid or invalid. The easiest way to set an NVMe SSD to fresh out of box is called an NVMe format command, but you can also TRIM/discard the entire LBA range, or execute a sanitize command. Why does this matter? Because SSDs perform much better when there is more free space due to garbage collection efficiency. Enterprise SSDs are tested in the worst-case conditions.
For NVMe, choose one of the following:
sudo blkdiscard -f /dev/nvme0n1
sudo nvme format -f /dev/nvme0n1
sudo nvme sanitize -a 2 /dev/nvme0n1
For SAS, choose one of the following:
sudo blkdiscard -f /dev/sg0
sudo sg_format -F /dev/sg0
sudo sg_sanitize [--quick] --crypto /dev/sg0
For SATA, choose one of the following:
sudo blkdiscard -f /dev/sda
sudo hdparm --user-master u --security-set-pass p /dev/sda
sudo hdparm --user-master u --security-erase p /dev/sda
sudo hdparm --yes-i-know-what-i-am-doing --sanitize-crypto-scramble /dev/sda
2. Run the workload pre-conditioning
Run the workload pre-conditioning. Now that we know there is no data, we must precondition the drive by filling it up with actual data. The most common method here is a full-span sequential write (the entire space of the drive, all the LBAs). This takes time, especially on a large capacity drive! For instance, a 7.68TB NVMe that can write at 4.4GB/s would take around 30 minutes. For running certain random write workloads you may have to precondition the SSD with completely random write data, and it still could take tens of hours to get into steady state. Testing random write or random mixed workloads are very challenging.
fio --name=sequential_write_precondition --ioengine=libaio --rw=write --bs=128k --size=100% --numjobs=1 --direct=1 --group_reporting --iodepth=16
If you want to run multiple loops of the sequential pre-conditioning phase you can add in --loops=2
3. Sequence the workloads
Run the workloads. If you are testing sequential workloads, do those first, then move on to random workloads. You could do this all in a single FIO file, but many times, it is easier to script. You can see from my example here, FIO scripts involve a lot of copy and pasting if you want to run a ton of different workloads.
I will share some examples of my favorite tools and dive deeper in running them in the advanced post. To understand the performance of an SSD, you have to know how it behaves under various workloads, my favorite for quick tests to understand how an SSD performs are:
- Sequential Read and Write, range of queue depth 1-128. For Sequential write typically larger block sizes are more interesting, 128k is enough to max out the bandwidth for the majority of SSDs
- Random read and write, range of queue depth and jobs to max out IOPS, range of block size from 4k-128k
- Random 70/30, mid queue depth, 4k-128k, look at read latency and mixed workload IOPS
- Seq write and random read (simulating many common database workloads) and measure read latency under write pressure
Of course, there are almost infinite permutations of read, write, and mixed workloads, block size, queue depths, access patterns, compressibility, etc. FIO is very useful at modeling workloads to make it easier to run benchmarks on multiple different storage devices. For instance, the folks over at Meta have open-sourced a tool called FioSynth to automate FIO with workloads that represent their actual data center workloads for boot, database, caching, etc. Performance targets for these are also included in the latest OCP Datacenter NVMe SSD Spec.
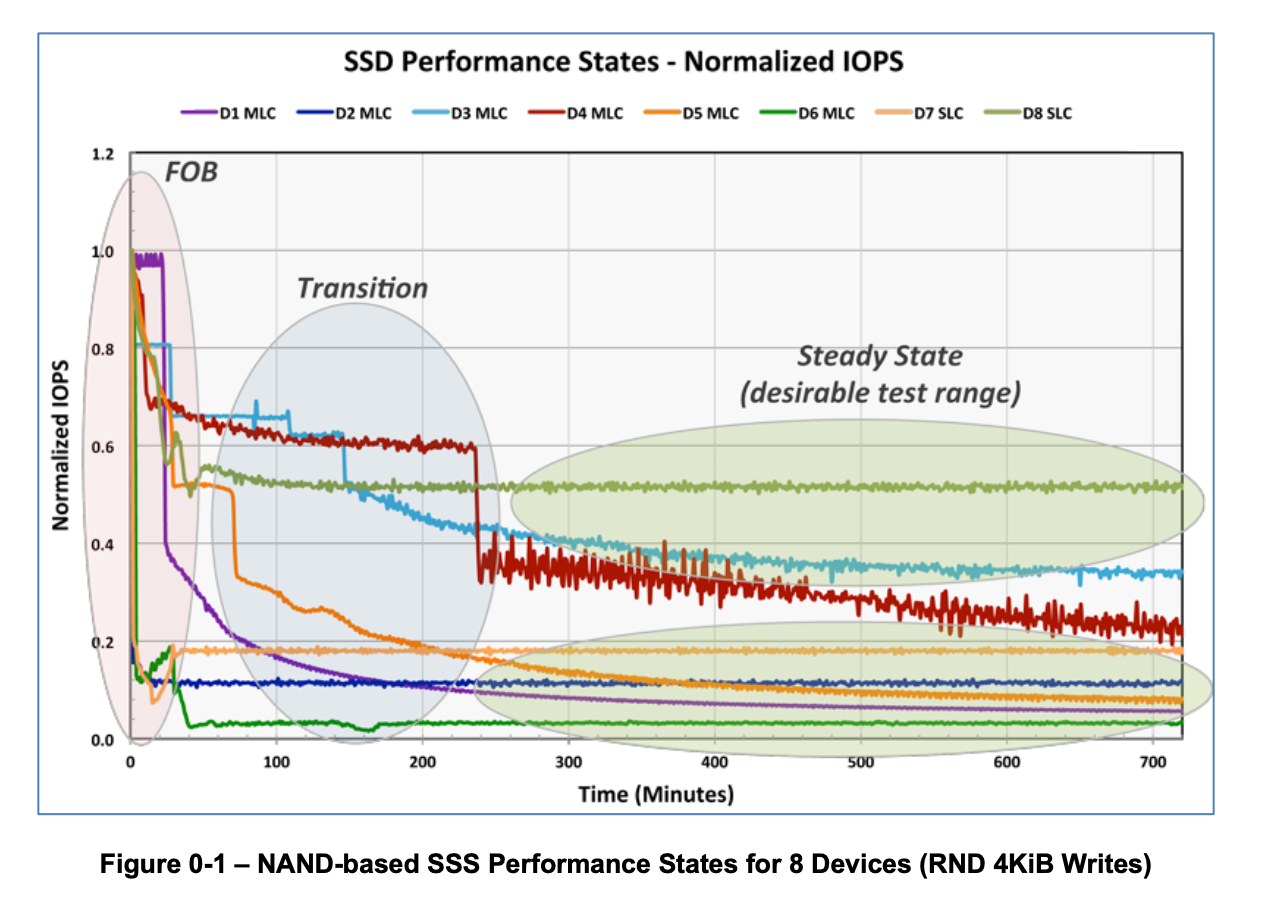
4. Measure the Performance in Steady State
Measure performance in a steady state. Sequential workloads generally have a low WAF, close to 1, so the variability and time to get to steady state is very fast. Random workloads with a higher WAF will have to wait until the garbage collection algorithms get to equilibrium, which in the worst case is typically 4k random write. As the WAF continues to grow, the performance will decrease until the drive reaches steady state. You have to understand and graph these workloads over time to understand when the drive enters a steady state. I recommend doing this manually to understand how the drive firmware responds to various workloads before using fancy FIO commands to measure and report steady-state performance. Remember that random write workloads can be extremely time-consuming, especially on larger-capacity SSDs, measured in many hours. Here is the example in the SNIA test spec.
To add the ability to graph over time in FIO, just add:
log_avg_msec=1000
write_bw_log=workload_bw.log
write_iops_log=workload_iops.log
5. Record and graph the results, and document system configuration
FIO gives a basic output that includes the IOPS, bandwidth, and latency. If you are looking to graph the output it is better to output in json format so you can have a script go through and graph. Graphing the data over a range of queue depths and block sizes will show how the SSD (which is a system built from controller, NAND, and firmware) responds. Generally, you want to graph bandwidth for sequential workloads and IOPS or bandwidth for random workloads. Latency is much better graphed as a histogram, otherwise called QoS or Quality of Service.
--output-format=json
System Configuration
Record as much system information as possible to be able to reproduce the results:
- SSD model family, model string, firmware version, capacity
- Operating system, kernel version
- Platform information, including CPU model, BIOS settings, and CPU frequency
sudo nvme list
sudo nvme id-ctrl -H /dev/nvme0n1
uname -a
sudo dmidecode -t 1
lscpu | grep "Model name"
cat /sys/devices/system/cpu/cpu*/cpufreq/scaling_governor
Running multiple workloads – Scripts
I have a basic bash script that runs through any combination of workloads. This isn't anything of high production value but is straightforward and easy to run. Just edit the name of the device and the workload attributes, and it will run all the block sizes and queue depths.
https://github.com/jmhands/scripts/blob/main/fio_sweep.sh
Keith over at Scaleflux has a nice script that takes the input of a csv with each row as a workload, then runs through all of them. I contributed my version of the python parser for the output, but this is a great script to make running a ton of workloads extremely easy. He has some reference workload scripts up as well to benchmark an SSD with many workloads.
https://github.com/kpmckay/fio-scripts
Here is me running a test script that does random read of various block sizes and queue depths that produced the graph at the top of the post.
git clone https://github.com/kpmckay/fio-scripts.git
wget https://gist.githubusercontent.com/jmhands/ee921b6597e229fc2384546630ed473d/raw/e7c1a1c6c7992dc1bd40d6203ea655a389e7897a/random_read.csv
sudo python3 runfio.py /dev/nvme0n1 /home/jm/random_read.csv /home/jm/p5520_randread
sudo chown jm:jm /home/jm/p5520_randread
python3 parsefio2.py /home/jm/p5520_randread
cat /home/jm/p5520_randread/parsed_summary.csv
Now I can graph that data in Excel or have ChatGPT make a fancy graph!
I mentioned Meta has a tool that can automate any number of FIO workloads here. If you want to run your own workload just modify one of the files in the workload suites folder.